Seeing Register Allocation Working in Java
Chris Seaton, 21 Aug 2020

When the Java Virtual Machine compiles your Java code to machine code, one of the jobs it needs to do is to decide where to store Java local variables and other similar temporary values. Your machine has no concept of local variables, so during compilation we need to decide what location in the stack memory, or in a machine register, it’ll use for each variable. This is called register allocation. Register allocation may seem like a complex, abstract, theoretical concept, but in this short post we’re going to show how we can relate the original Java code first to the theory, then to how the compiler sees it, and then to the resulting machine code. What we want to show is that we can easily see the concepts working in practice in a real compiler.
We’re going to be showing output of the Graal just-in-time compiler, but the concepts are similar for other Java just-in-time and ahead-of-time compilers, and for compilers for many other languages.
This Java code runs the method test in a loop to trigger compilation. There is a read method to produce values, a write method to consume them, and a barrier method that simplifies some things and we’ll explain it in the end notes.
class Test {

    public static void main(String[] args) {
        while (true) {
            test();
        }
    }

    private static void test() {
        int v0 = read();
        barrier();
        int v1 = read();
        barrier();
        write(v0);
        barrier();
        int v2 = read();
        barrier();
        int v3 = read();
        barrier();
        write(v1);
        barrier();
        write(v2);
        barrier();
        write(v3);
    }

    private static int read() {
        return 14;
    }

    private static void write(int value) {
    }

    private static void barrier() {
    }

}
We’re going to look at the register allocation in the test method. We’ve removed the calls to barrier between each line for simplicity.
int v0 = read();
int v1 = read();
write(v0);
int v2 = read();
int v3 = read();
write(v1);
write(v2);
write(v3);
We can reason about the register allocation for this program just by looking at the Java code. We want to think about how long each variable needs to be stored for. We call this the live ranges, or intervals. We can do this by drawing a table with each line of code being a line, and having a column for each variable, with a bar showing how long the variable needs to be stored until it can be forgotten.
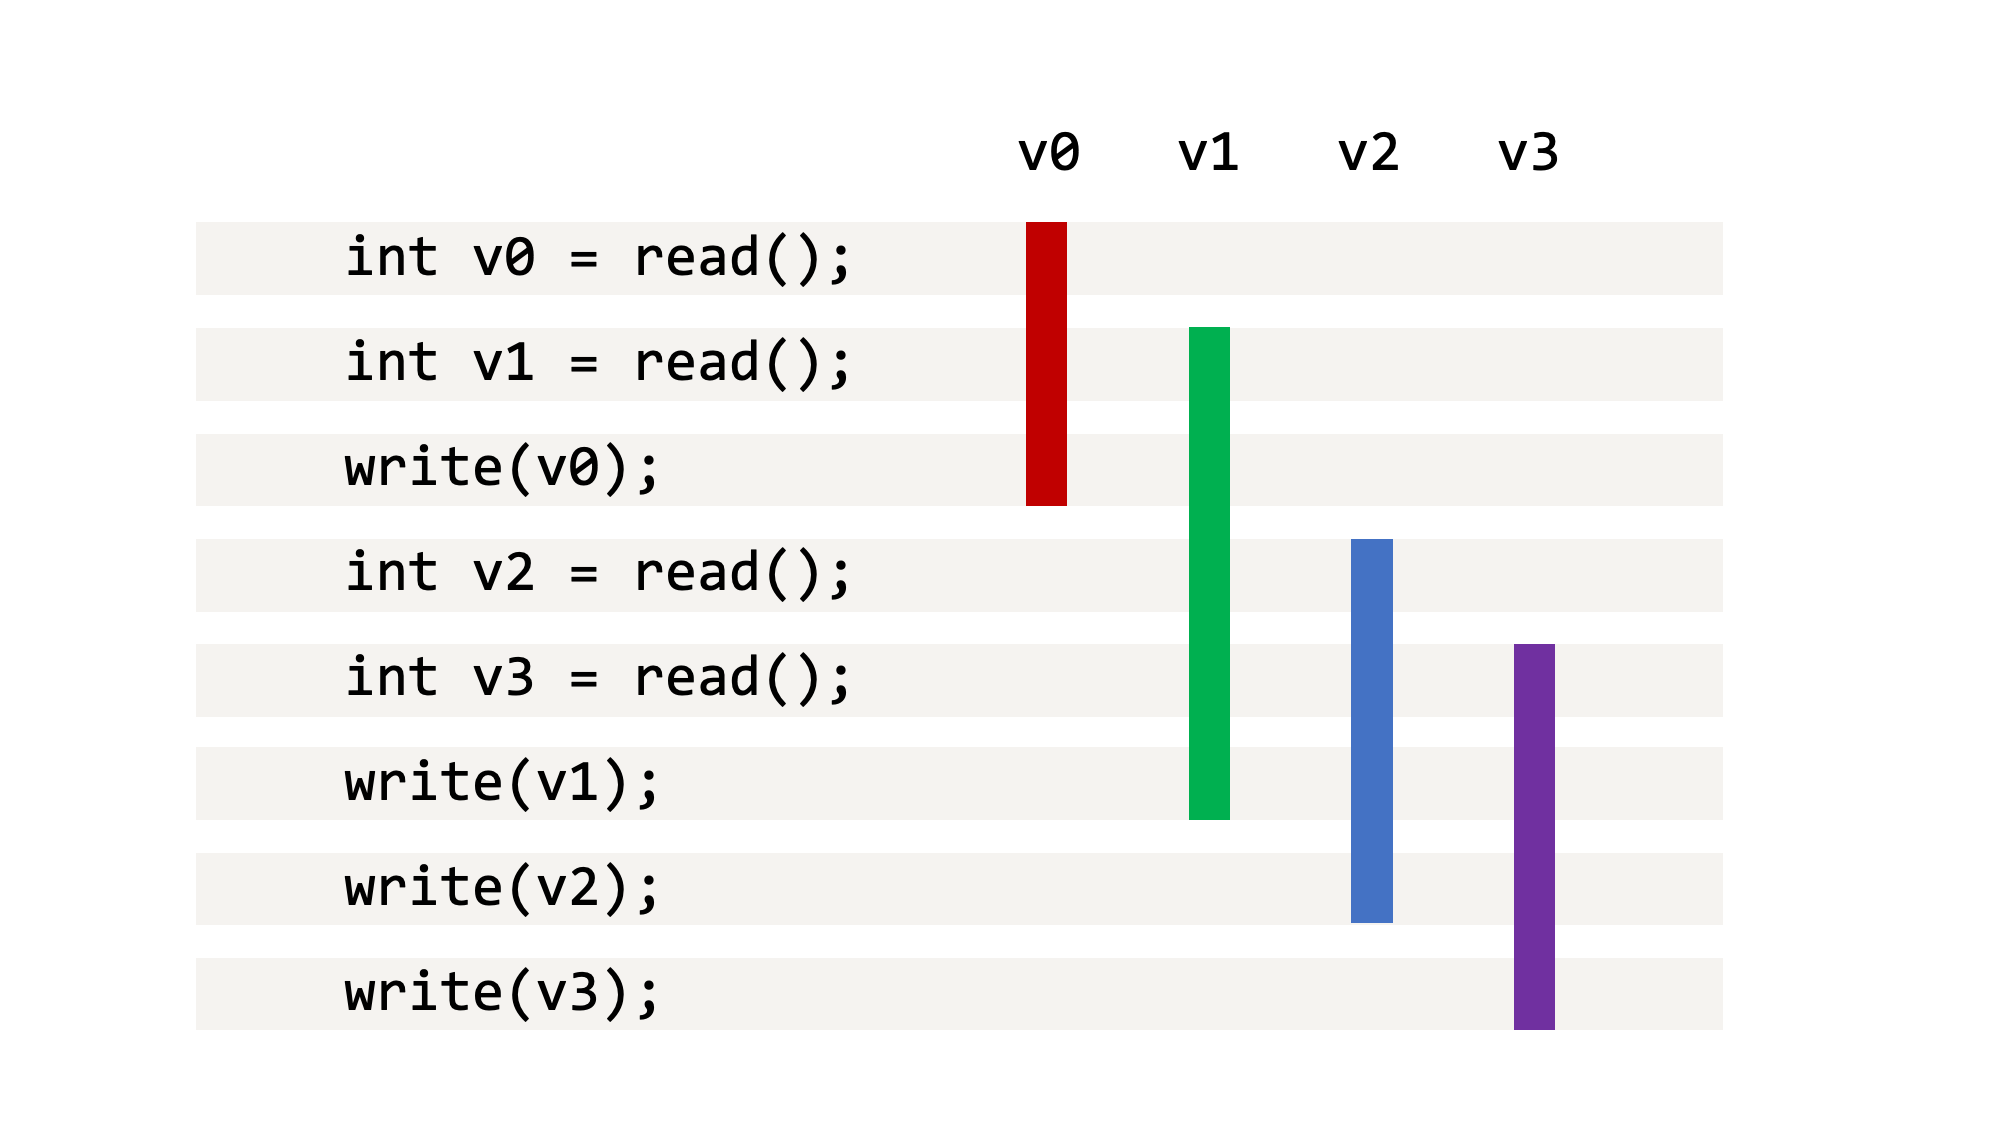
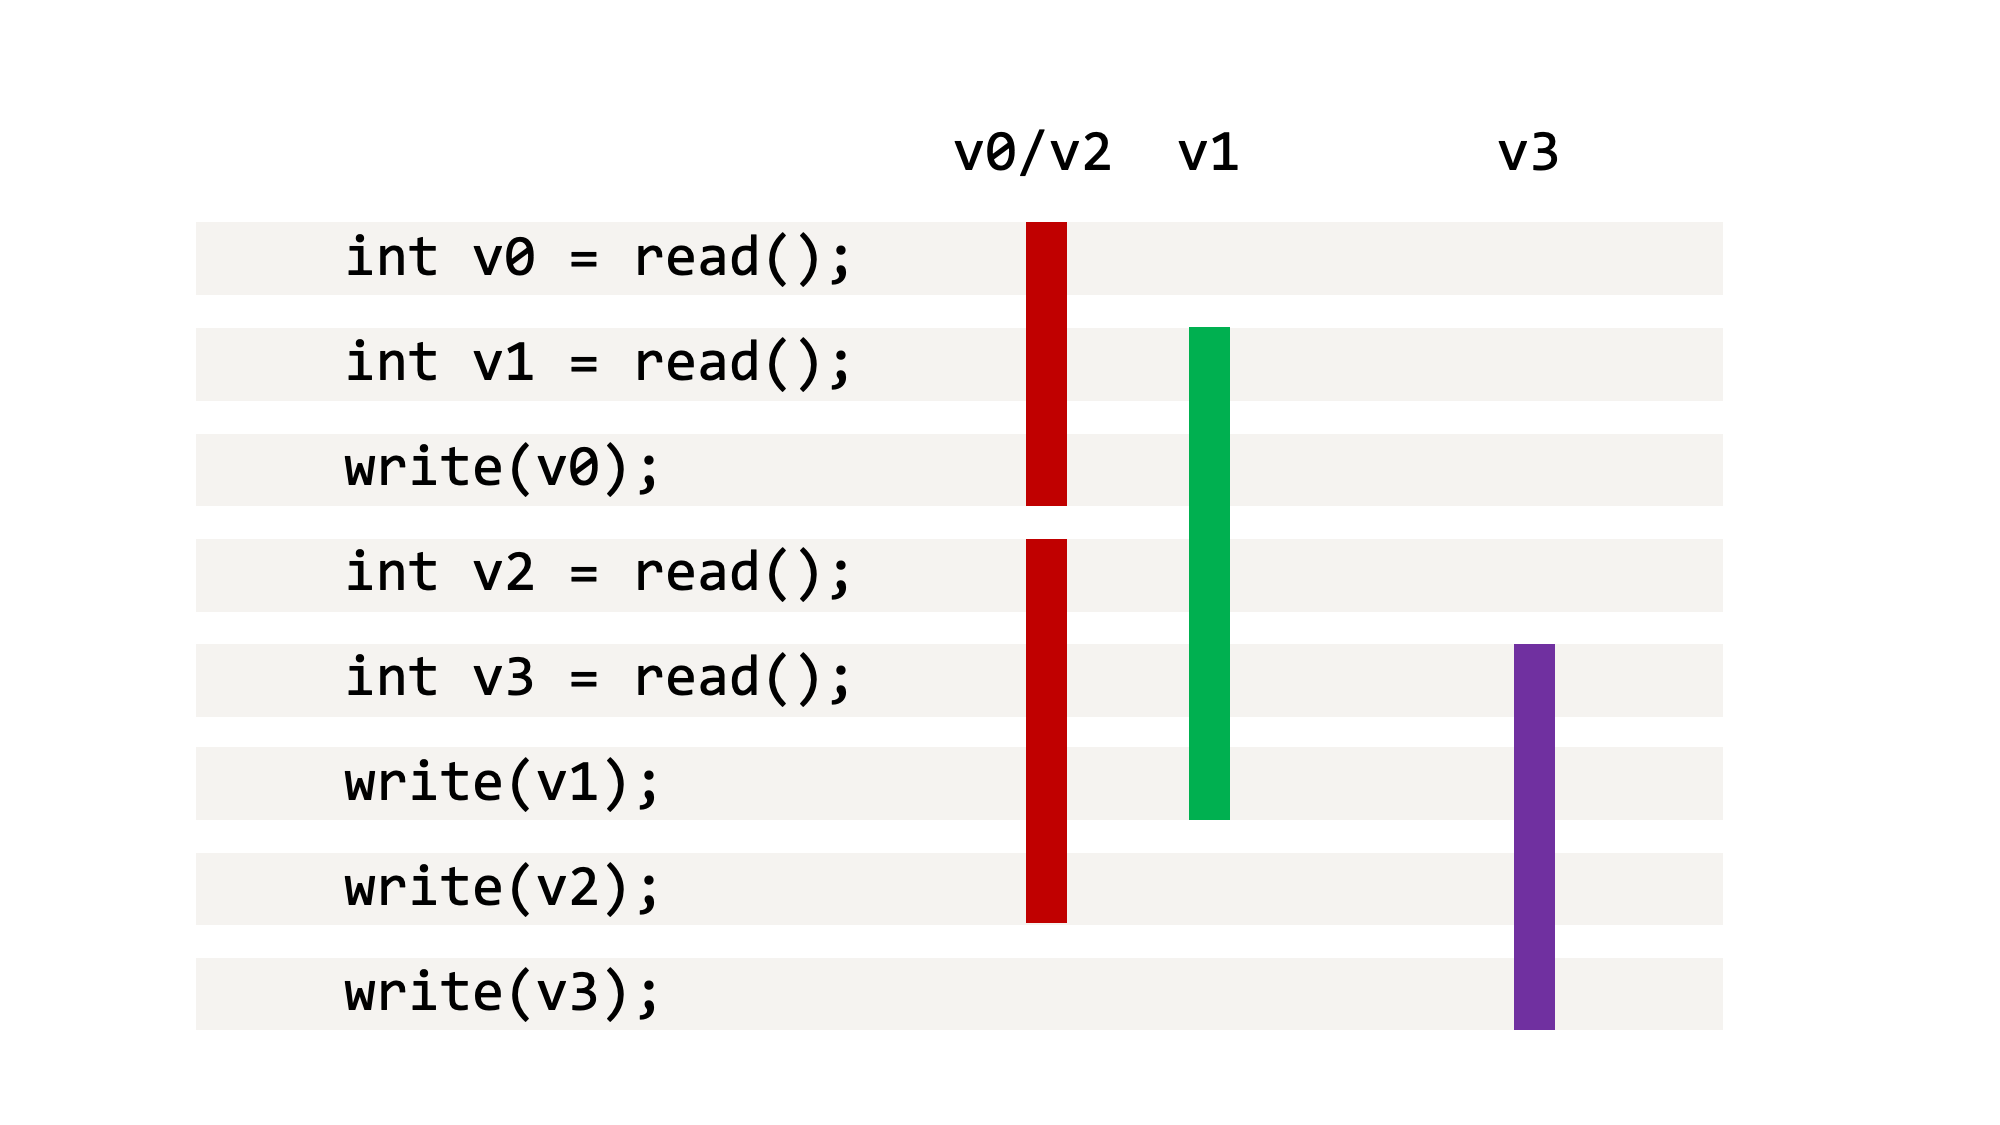
The key observation here is that we’ve got four variables that we need to keep alive, but it looks like we can probably fit them into just three storage locations. See how the bars for v0 and v2 never overlap. v0 can be discarded before v2 is ever created, so we could re-use the storage for v0 for v2 later on. We could instead share storage for v0 and v3 if we wanted to, but let’s use a first-fit approach and re-use the first storage location that’s available.
A more formal way to look at register allocation is to build a graph where each variable is a node, and there are edges between the nodes if they’re live at the same time. This is an interference graph.

Then we solve the problem of giving each node a color, so that adjacent nodes never have the same color. This is graph coloring. We could solve the problem by giving each node a unique color, but we already know this is wasteful.

We can see the two solutions we already came up with.


To now see how Java allocates storage in practice, we can use GraalVM CE 20.1 Java 8 to compile the Java code as normal.
% ./graalvm-ce-java8-20.1.0/Contents/Home/bin/javac Test.java
We can then run it with some flags set to see what it does with the code. We use -XX:CompileOnly=Test::test so that the calls to read, write and barrier do not inline. If they did inline it would allow the compiler to significantly restructure the program and would obscure what we’re looking for. We use -Dgraal.Dump=:3 to write out how the compiler understands the program to a file we can inspect later. We use -XX:+UnlockDiagnosticVMOptions -XX:+PrintAssembly to print the resulting machine code as assembly. We’ll need hsdis in the current directory in order to run this.
% ./graalvm-ce-java8-20.1.0/Contents/Home/bin/java -XX:CompileOnly=Test::test -Dgraal.Dump=:3 -XX:+UnlockDiagnosticVMOptions -XX:+PrintAssembly Test
Now we’re going to use a tool called the c1visualizer. This tool allows us to look at the how the compiler understands your program in the back-end, when it’s generating code and allocating storage locations to variables.
% jdkhome=./graalvm-ce-java8-20.1.0/Contents/Home ./c1visualizer/bin/c1visualizer
On the left we can see the program move through various phases of the compilation back-end.
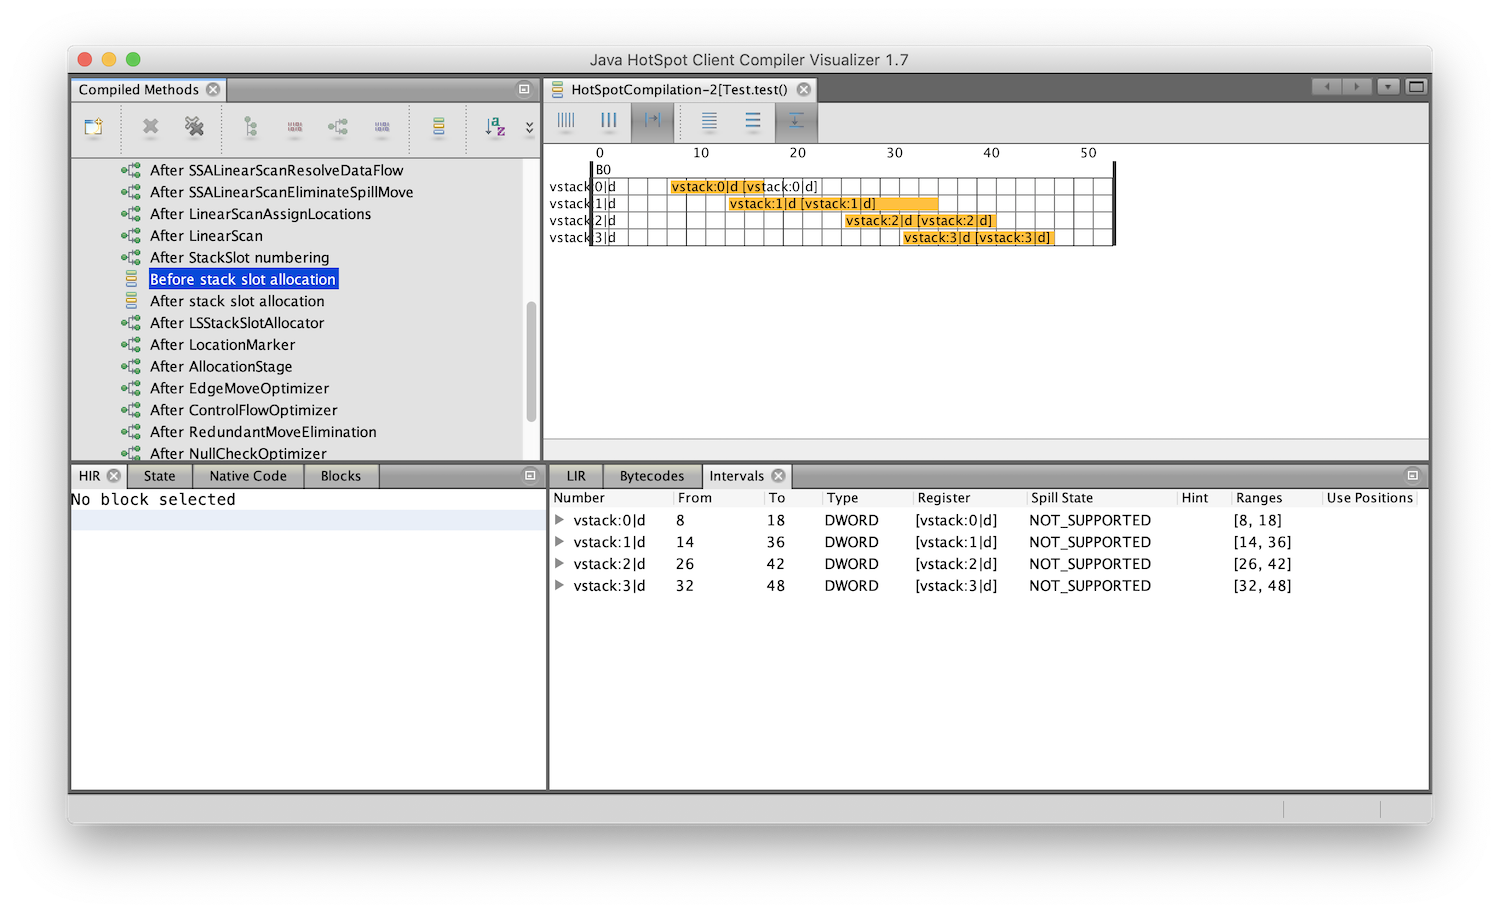
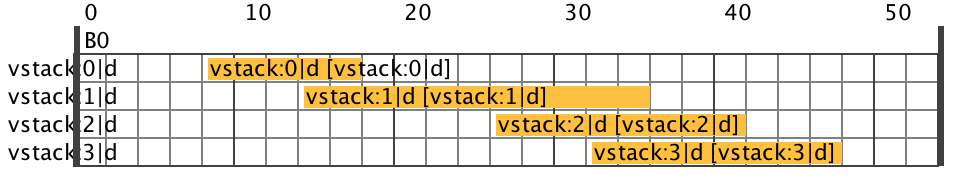
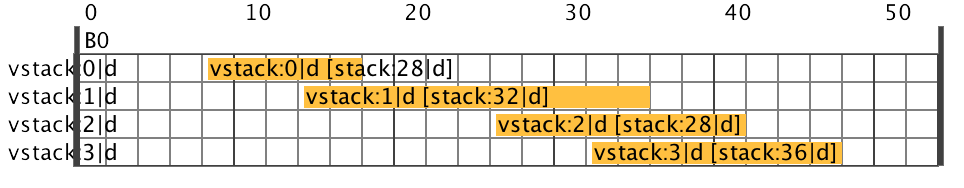
If we look at Before stack slot allocation, we can see v0 to v3. In this view, the variables are rows, and the now each column is a Java bytecode instruction in the method, so it’s been rotated ninety degrees. We can see the same four intervals we had in the source code.
If we look at After stack slot allocation, we can see it’s now allocated machine stack locations for these variables. These numbers are the offset from the start of the stack frame. They don’t go up by four each time, as they are byte addresses, and we’re storing a Java int which is four bytes, and they don’t start at zero as Java stores some other information on the stack beside our variables. We also can see it’s done what we did with pencil-and-paper - it’s stored v0 and v2 in the same stack location - they’re both in stack:28.
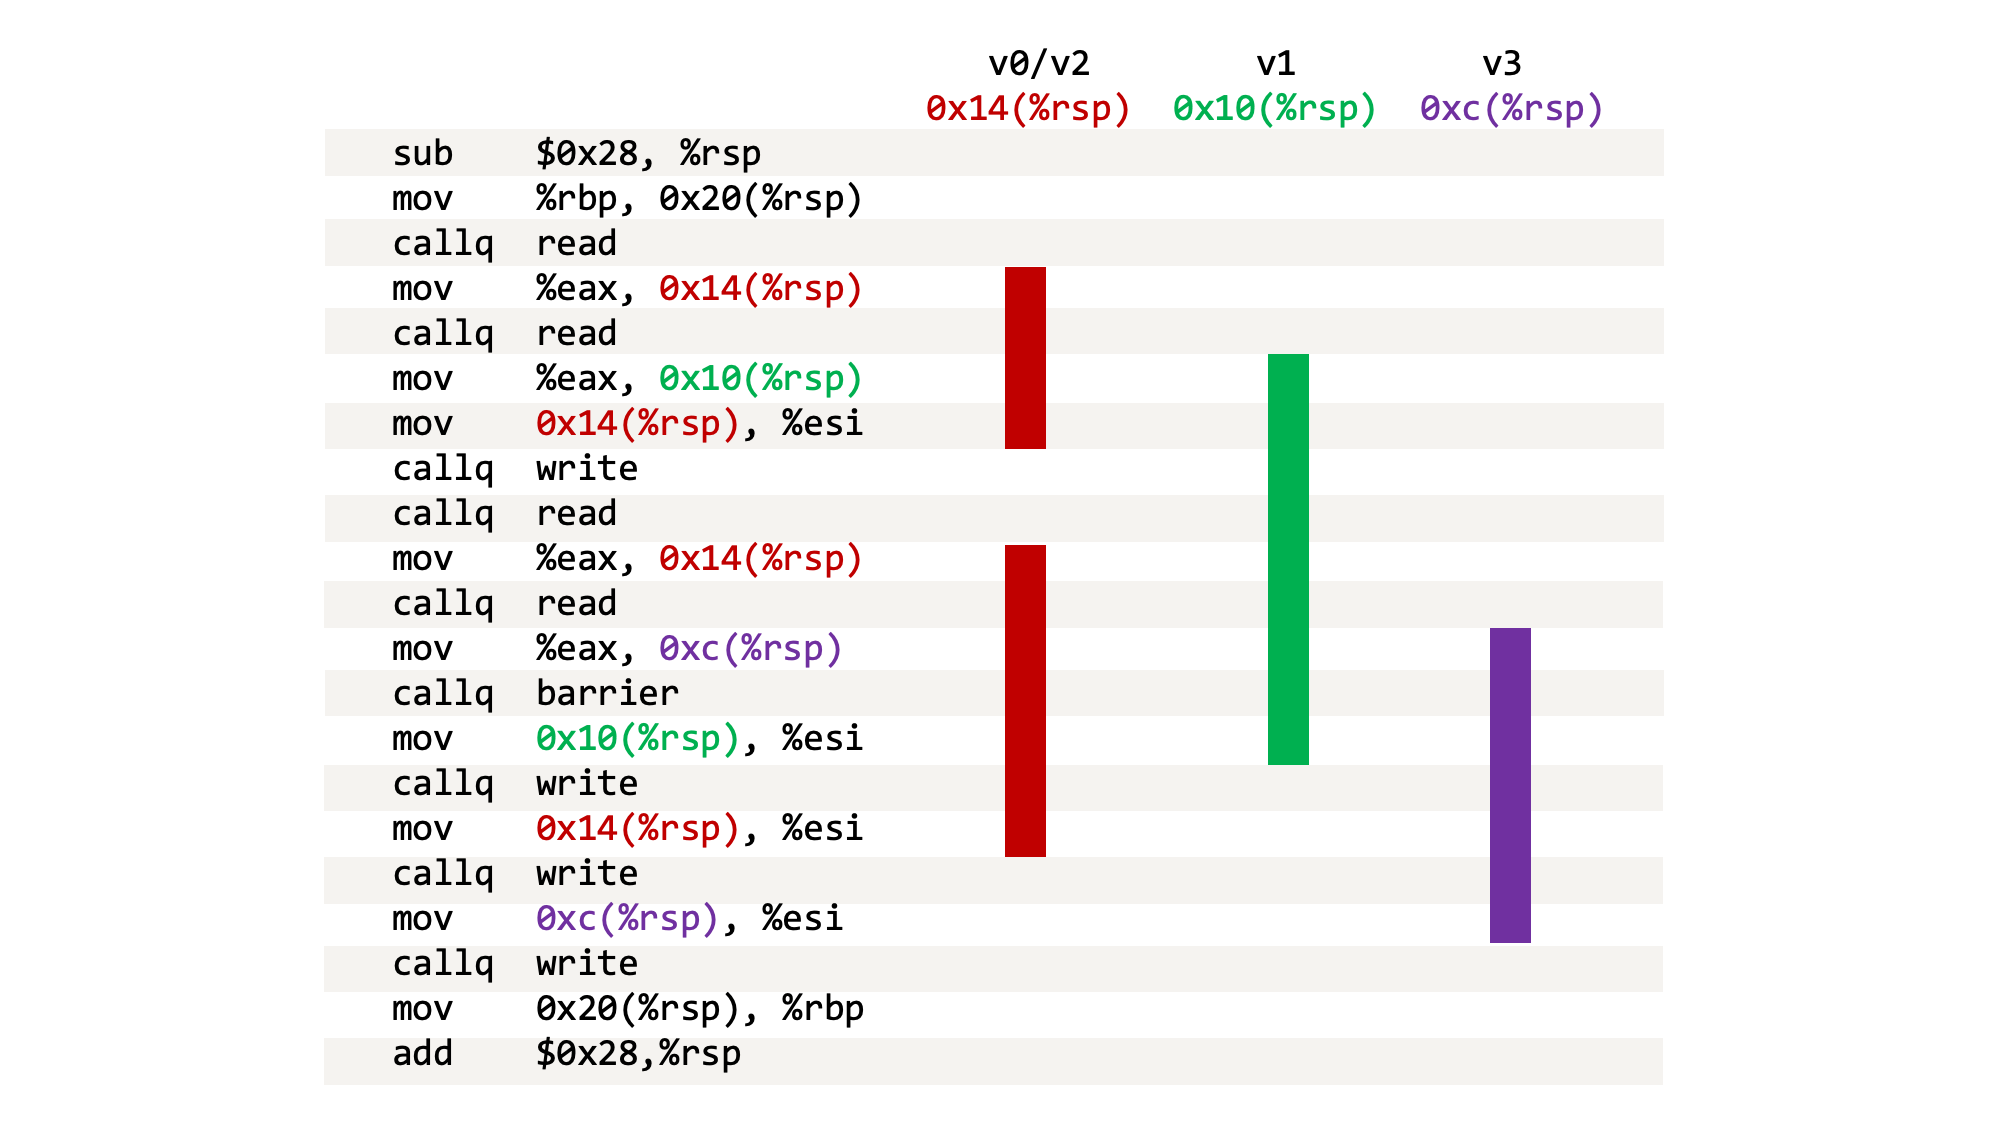
Finally, we can look at the disassembled machine code generated by the compiler. We’ve simplified it slightly for clarity and we’re still removing the calls to barrier. Each time we call read it returns the value in the %eax register, so an instruction mov %eax,0x14(%rsp) is for example storing the return value into 0x14(%rsp), which is another way to write %rsp + 0x14. %rsp is the stack pointer, so stack locations are addressed relative to the bottom of the current stack (bottom because it grows downward.)
sub    $0x28,%rsp
mov    %rbp,0x20(%rsp)
callq  read
mov    %eax,0x14(%rsp)
callq  read
mov    %eax,0x10(%rsp)
mov    0x14(%rsp),%esi
callq  write
callq  read
mov    %eax,0x14(%rsp)
callq  read
mov    %eax,0xc(%rsp)
mov    0x10(%rsp),%esi
callq  write
mov    0x14(%rsp),%esi
callq  write
mov    0xc(%rsp),%esi
callq  write
mov    0x20(%rsp),%rbp
add    $0x28,%rsp
We can see again, that the first and third calls to read - that’s v0 and v2 - return a value that is stored into the same location - 0x14(%rsp). v1 goes into 0x10(%rsp) and v3 into 0xc(%rsp). We can draw the same table for this machine code as we did for our Java code.
The point of all this is all these diagrams match up in practice! The pencil-and-paper reasoning of the Java code with tables and interference graphs that an undergraduate might do in an exam, matches up with how the production compiler understands it, and matches up with the machine code produced and run. We can see the theory working in practice, pretty directly.
Notes
We talked about variables being allocated to storage locations. What we really mean by variable is anything that the compiler may want to store - they may not correspond to any real local variables, and not every local variable is necessarily stored.
We started talking about register allocation, but then generalized that to storage location, and then the compiler actually used the stack and no registers. The reason for this is that the values are live across calls, and HotSpot’s internal calling convention does not have any callee-saved registers - the caller must ensure all values are out of registers and saved on the stack.
The purpose of the barrier call is that without it the live ranges shrink somewhat due to them not having to be kept alive for as long, so that they end up not overlapping as we intend. We turned off inlining because without it our barrier call would not work as intended.
The actual register allocation algorithm Graal is using is the linear scan algorithm.
If you noticed that the stack locations shown by the c1visualizer don’t match the offsets in the machine code, it’s because they count in different directions and c1visualizer is also accounting for the return address on the stack. If you noticed that there is apparently empty space in the stack frame, which is due to an extra slot used during deoptimization, and alignment.
Tom Rodriguez helped me answer some questions about the HotSpot calling convention and frame layout.
- More information about TruffleRuby
- Stamping Out Overflow Checks in Ruby
- The Future Shape of Ruby Objects
- Seeing Escape Analysis Working
- Understanding Basic Truffle Graphs
- Context on STM in Ruby
- Seeing Register Allocation Working in Java
- Understanding Basic Graal Graphs
- Understanding Programs Using Graphs
- Low Overhead Polling For Ruby
- Top 10 Things To Do With GraalVM
- Ruby Objects as C Structs and Vice Versa
- Understanding How Graal Works — a Java JIT Compiler Written in Java
- Flip-Flops — the 1-in-10-million operator
- Deoptimizing Ruby
- Very High Performance C Extensions For JRuby+Truffle
- Optimising Small Data Structures in JRuby+Truffle
- Pushing Pixels with JRuby+Truffle
- Tracing With Zero Overhead in JRuby+Truffle
- How Method Dispatch Works in JRuby+Truffle
- A Truffle/Graal High Performance Backend for JRuby